Analytics & Reporting
Reports
The reports dashboard is your starting point for everything eCommerce in WP EasyCart. Get quick stats for daily, weekly, or yearly sales — see new orders at a glance, clear pending product reviews, and track total customer value, all from a single screen.
Watch the Reports Walkthrough
See how the dashboard pulls together your sales, shipping, taxes, discounts, and refunds — and how to export any of it to a spreadsheet.
Reports & Dashboard Setup
Track your online business with a full reporting dashboard — the key stats and graphs you need to compare sales, shipping, taxes, discounts, and refunds, then export it all.
Quick Start
Get reporting in three steps
Open the dashboard
From the WP EasyCart menu on the left, select Reports. The dashboard loads with your store’s headline stats right away.
Pick a date range
Switch between Daily, Weekly, or Yearly — or set a custom range to compare the current period against a previous one.
Chart & export
Toggle between line and bar charts, then export any selection to a CSV file for deeper analysis in a spreadsheet.
The Dashboard
Reading the report dashboard
From the dashboard you can jump straight into managing products, checking orders, reviewing comments, or managing customers — either from here or the main EasyCart menu on the left.
The WP EasyCart reports dashboard
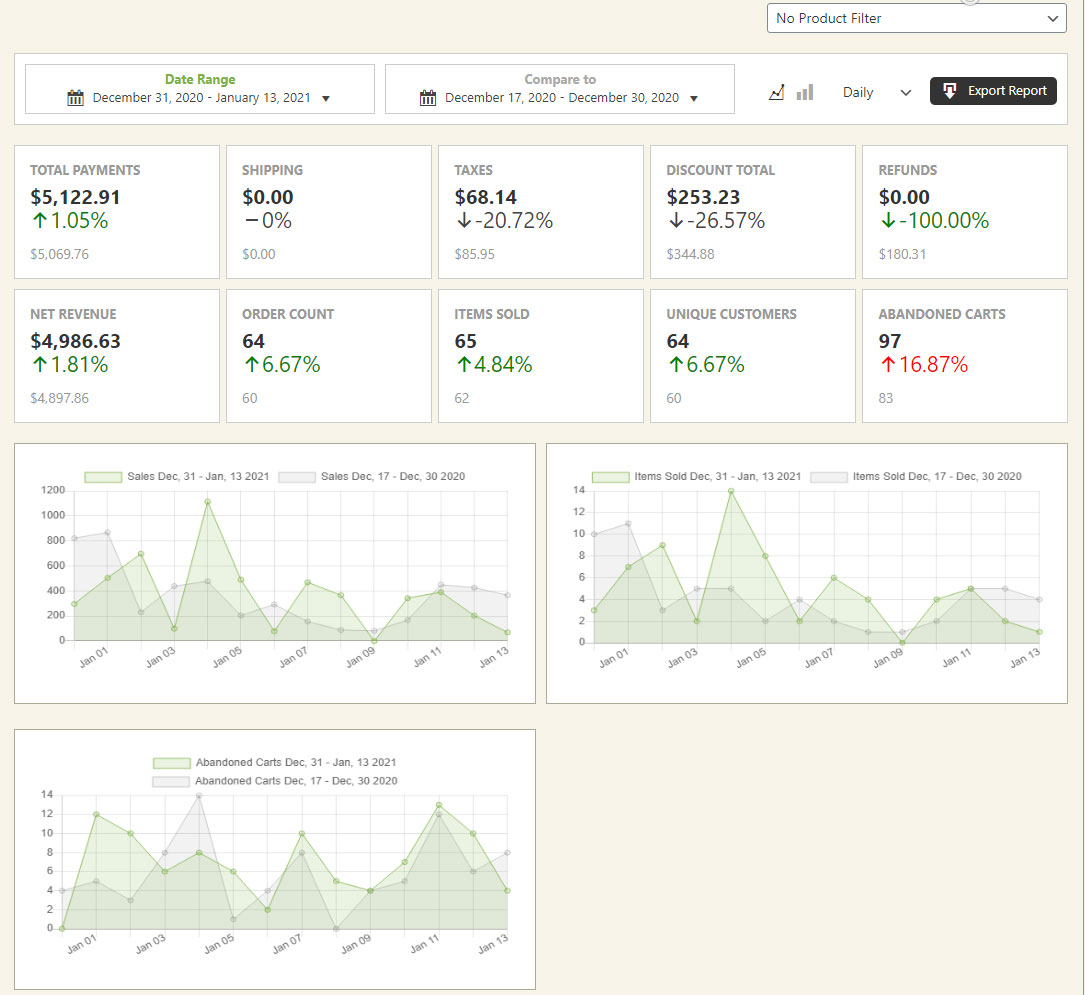
The dashboard makes it easy to compare key metrics across your store. Select a date range to look at previous periods or build custom comparison ranges, switch between Daily, Weekly, and Yearly views, and toggle line or bar charts. When you want the raw numbers, export any selection to CSV for easy manipulation in a spreadsheet.
Reference
What the dashboard tracks
Every panel below updates with the date range and chart type you choose, so you can compare any metric across periods.
Metrics & comparisons
The dashboard surfaces the numbers that matter most for a running store, each as its own comparable panel:
- Sales
- Shipping
- Taxes
- Discounts
- Refunds
- New orders
- Pending product reviews
- Total customer value
Date ranges & chart types
Choose Daily, Weekly, or Yearly statistic ranges, or define a custom comparison range to measure the current period against a previous one. Each panel can be viewed as a line or bar chart, whichever reads more clearly for the metric you’re reviewing.
Exporting your data
Any selection you’ve made on the dashboard can be exported to a CSV file, giving you a clean spreadsheet to filter, pivot, or share with your accountant outside of WordPress.
Flex-Fee panels
If you add Flex-Fees through Settings → Flex Fee, each fee gets its own panel here on the reports page — giving you the same comparison and export tools for every additional fee you charge. Learn more about Flex-Fees.
Put your store’s numbers to work
Track sales, compare periods, and export everything you need — the reporting dashboard is built into every WP EasyCart store.